
Today, more and more publishers are beginning to understand the power of analyzing their website data. In fact, according to Orbit Media, 94.9% of the top 200 marketing websites use Google Analytics.
Since the rise of analytics tools, analyzing data has become one of the daily activities of publishers. It can give you insights into which types of topics and content interests your audience and drives the most engagement. Extracting actionable insight from audience data is key to the long-term success of running a website.
Below, I’ve listed three categories of metrics I believe publishers should consider as key groups to measure, analyze and optimize to improve their site performance. These by no means are all of the metrics publishers should measure, but they are highly important.
Audience metrics
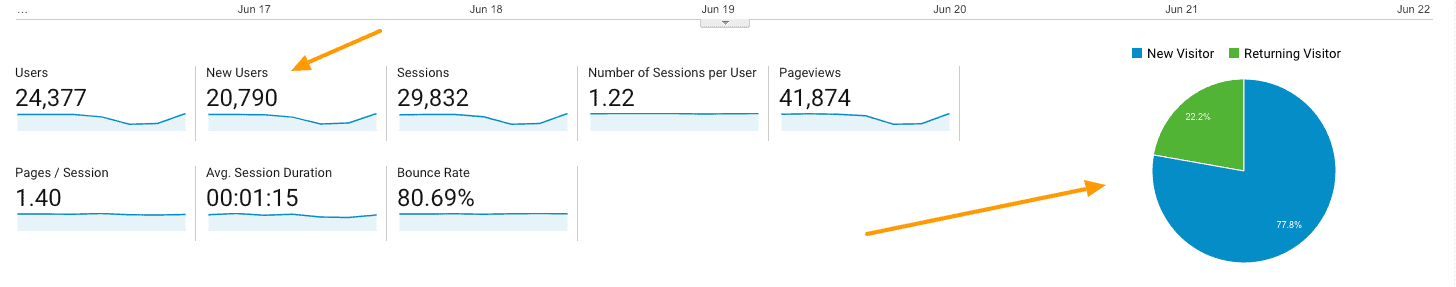
New vs. returning visitors
The ratio of returning visitors to total visitors is a key metric for answering the question, “Is my content good enough that people are coming back for more?”.
You certainly always want new visitors to reach your site, but it’s just as important to measure the percentage of returning visitors and work to increase that number over time.
Audience segments
Being able to track engagement sliced by audience segments lets you compare what content is performing best for each of the segments of your audience. You’ll be able to distinguish segments according to factors like:
- The device used for access
- Referral channel
- Interest categories
- Geography

Community metrics
Your Community consists of the people who have opted-in to receive your updates recurrently, and are actually viewing said content.
There are endless possible ways for users to receive recurring content digitally: via social media, apps, email newsletters, etc. Publishers need to be open to new opportunities to build community as they happen.
Consistent community growth will guarantee the success of your brand regardless of any changes done to your digital platforms. Since you have an audience of people that want to receive your content, no matter which platform that content is on.
Engagement metrics
Scroll depth
Scroll depth helps publishers to assess how far a reader got into a specific article or content asset.
Understanding scroll depth can help you realize if your content matches your readers’ search intent, and at which point do they feel like they’ve gotten all of the information they need. This can help you understand whether your CTAs and actionable steps are placed correctly, as well as preferred content length or format.

Read time
By analyzing the read time of different posts and pages, publishers can see how long the visitor spent reading the article, providing a more accurate depiction of their interest. More often than not, readers will skim over your posts instead of reading the whole thing, following what is called an F-shape.
Bounce rate
Bounce rate tracks the percentage of website visitors who land on your site, perform no action, and then leave. Google calculates bounce rates as single-page sessions divided by all sessions.
A page with high traffic but a high bounce rate as well might tell you that the headline was catchy and engaging, but possibly misleading – in the end, visitors didn’t find what they wanted there.
Unique visitors
The Unique Visitors metric gives your team insight into how compelling and popular your site is. Unique visitors indicate the overall awareness of your actual website. It lets you know how many individuals visit your site.
In addition, target warmer leads who’ve already been to the website. Ian Kelly of Vital Design notes “Unique visitors help us determine who exactly you should put emphasis on, as these visitors are returning to your website and are more engaged than first-time visitors.”
Pages per visitor
This metric provides a high-level understanding of reader engagement on your site. Content that supports other content helps fuel a virtuous circle where people continue through to other articles while learning and receiving value.
If you can determine how many pages each visitor views, you should be able to figure out a strategy for increasing that number by identifying recurring trends.
Monetization metrics
Revenue
Revenue tracking can help you see where you’re making more money – subscription sales, products, ad units, etc – so that you can optimize acquisition budgets accordingly. It can also give you an idea as to where your most valuable visitors are coming from, and invest more into acquisition from those channels.
A couple of different revenue metrics you should track overtime are:
- Revenue per visitor
- Revenue per page
- Revenue per audience segment
Fill rate
Fill rate is the ratio of the number of ad requests your ad source received, divided by the number of ads actually sent. There are many ways to improve fill rates, such as having multiple ad slots on a page, and tracking it is important for identifying pages with missed opportunity.
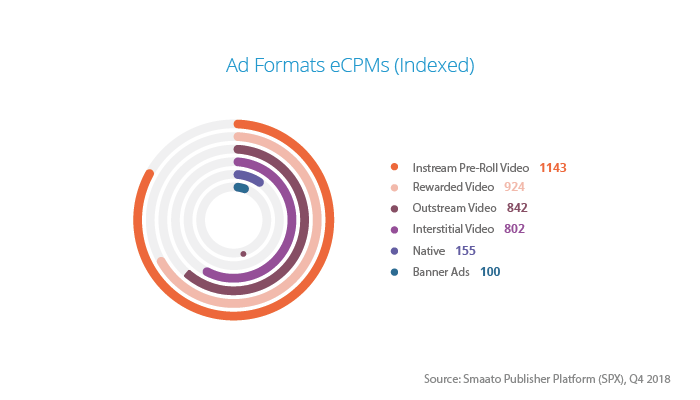
eCPM
eCPM (effective cost per mille) is the ad revenue of a publisher per 1000 impressions. It is calculated by dividing the ad revenue by the number of ad impressions and then multiplying the quotient by 1000.
Tracking eCPM and its component measures, impressions, will help you understand which of your ad units are the most valuable and what placements and formats are most profitable to you.
CTR
Click-through-rate is an important metric for advertising. Publishers can see which ads are receiving the most engagement from users, and use that information to change the amount, density, placement, and subject matter of advertisements.
Page load time
This is a special one – while analyzing your page speed and load time won’t give you direct insight into the way visitors interact with your content, it is one of the most important factors to influence user experience and search engine rankings.
You may find that high page-load times reduce the time spent on your website, therefore reducing monetization opportunities like ad views.
Publishers need to ensure a positive user experience on their site or app and reach the point of catering to both website visitors and advertisers.
Popular analytics tools
Conclusion
The most important thing is that publishers are using analytics tools. There is much to be learned by studying the behavior of visitors and how different types of articles perform.
Act on these KPIs (key performance indicators) by fully optimizing your site to maximize the value of each page, ad unit, audience segment, and unique visitor. By taking this approach, you increase the engagement of your readers and attract new readers as well.